Statistics in Practice: How Hockey Teams Respond When They’re Ahead or Behind

Statistics in Practice: How Hockey Teams Respond When They’re Ahead or Behind
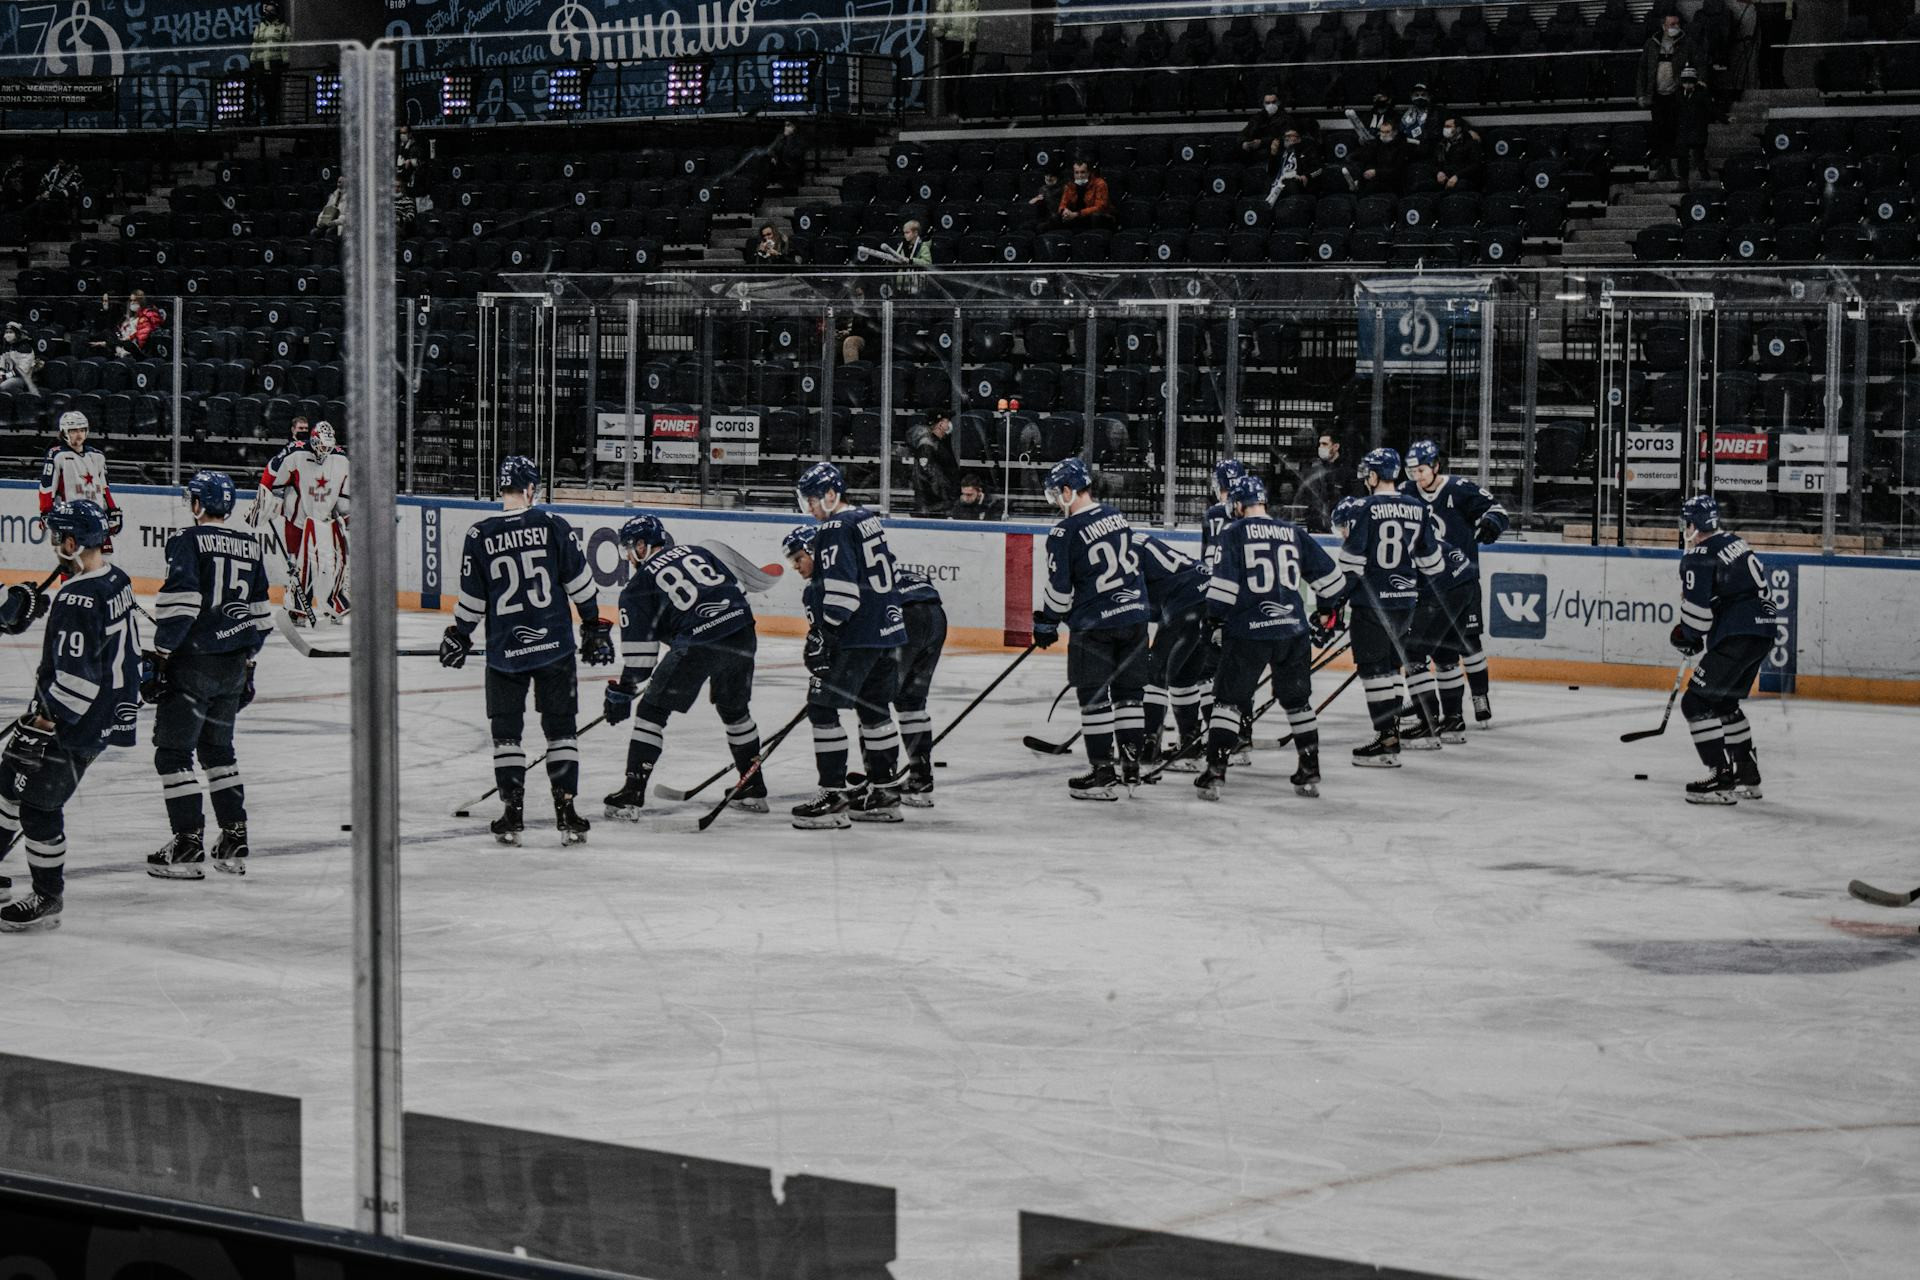
How does a hockey team change its style of play when it’s leading on the scoreboard—or when it’s chasing a comeback? Data from the NHL and other professional leagues reveal clear patterns in how teams react to the score. It’s not just about tactics; it’s about psychology, risk, and energy. Let’s dive into the numbers and see how analytics can uncover the behavior of teams under pressure.
When Leading: Playing It Safe
Most teams become more conservative when they’re ahead. This shows up in metrics like shot attempts per minute, puck possession, and offensive zone entries. According to NHL “score effects” data, a team’s shot attempts typically drop by 10–15% when leading by one goal. At the same time, the number of dump-ins and defensive clears increases.
It’s a natural reaction: protect the lead. But pulling back too much can give the opponent momentum. Teams that sit back risk getting trapped in their own zone and losing control of the game. Analytics show that teams maintaining an active forecheck are more likely to hold their lead—even though it demands more energy.
When Trailing: Turning Up the Risk
When a team is behind, everything changes. Coaches shorten the bench, increase the tempo, and give top players more ice time. Data show that teams trailing by a goal increase their shot rate by up to 20% in the third period. Defensive structure often suffers—more turnovers, more odd-man rushes against.
Interestingly, teams down by one goal often play their best hockey in the final ten minutes. That’s when urgency peaks. But when the deficit grows to two or more goals, efficiency drops sharply. NHL statistics show that the chance of a comeback falls from around 18% when down by one to under 5% when down by two.
Power Plays and Empty Nets: The Final Gamble
The last minutes of a game are a study in risk management. When a team pulls its goalie for an extra attacker, the odds of scoring rise—but so do the odds of conceding. Recent NHL data show that teams score roughly one goal for every 6.5 minutes of empty-net time, but they also allow one for every 8 minutes. The decision of when to pull the goalie is a delicate balance between numbers and instinct.
Some coaches pull the goalie with three minutes left, while others wait until the final minute. Statistics suggest that taking the risk earlier can pay off—but only if the team can sustain pressure in the offensive zone.
Momentum and Psychology: The Numbers Behind Emotion
Hockey is a game of speed and skill, but psychology plays a huge role. Data show that teams scoring quickly after conceding often shift the game’s momentum. These are called “response goals,” and they have a measurable impact.
A team that has just tied the game has, on average, a 12% higher chance of scoring the next goal within five minutes. That surge of confidence and energy can change everything—something coaches increasingly try to harness through timeouts and line adjustments.
Læs også:

Data as a Coaching Tool
Today, most NHL teams use advanced analytics to understand how game situations affect performance. By analyzing shot quality (expected goals), zone control, and passing patterns, coaches can adjust strategies in real time.
A team that knows it tends to sit back too much when leading can work on maintaining offensive pressure. Conversely, a team that loses structure when chasing a goal can train to stay patient and disciplined. In this way, statistics become a tool for balancing risk and control.
Conclusion: The Score Shapes the Game
Hockey is a game of moments—but also of patterns. The numbers show that teams react predictably to the score: cautious when ahead, aggressive when behind. The best strategy often lies in the middle—protecting a lead without losing initiative, and pushing for a goal without losing structure.
For coaches, players, and fans alike, analytics offer a window into the psychology of the game. They reveal that behind every shot, every shift, and every decision lies a pattern—and understanding that pattern can be the difference between winning and losing.
Læs også: